For modern people, free divination online is a wonderful opportunity ...

Three methods are mainly used in X-ray diffraction analysis
1. Laue method. In this method, a radiation beam with a continuous spectrum is incident on a stationary single crystal. The diffraction pattern is recorded on a still photographic film.
2. Single crystal rotation method. A beam of monochromatic radiation is incident on a crystal rotating (or oscillating) around a certain crystallographic direction. The diffraction pattern is recorded on a still photographic film. In a number of cases, the film moves synchronously with the rotation of the crystal; this variation of the rotation method is called the layered line sweep method.
3. Method of powders or polycrystals (Debye-Scherrer-Hull method). This method uses a monochromatic beam of rays. The sample consists of a crystalline powder or is a polycrystalline aggregate.
The Laue method is used at the first stage of studying the atomic structure of crystals. It is used to determine the syngony of the crystal and the Laue class (the Friedel crystal class up to the center of inversion). According to Friedel's law, it is never possible to detect the absence of a center of symmetry on a Lauegram, and therefore adding a center of symmetry to the 32 crystal classes reduces their number to 11. The Laue method is mainly used to study single crystals or coarse-grained samples. In the Laue method, a stationary single crystal is illuminated by a parallel beam of rays with a continuous spectrum. The sample can be either an isolated crystal or a fairly large grain in a polycrystalline aggregate.
The formation of a diffraction pattern occurs during the scattering of radiation with wavelengths from l min \u003d l 0 \u003d 12.4 / U, where U is the voltage on the X-ray tube, to l m - the wavelength that gives the intensity of the reflection (diffraction maximum) exceeding the background at least by 5 %. lm depends not only on the intensity of the primary beam (atomic number of the anode, voltage and current through the tube), but also on the absorption of X-rays in the sample and the film cassette. The spectrum l min - l m corresponds to a set of Ewald spheres with radii from 1/ l m to 1/l min , which touch the node 000 and OR of the crystal under study (Fig. 1).
Then, for all OR nodes lying between these spheres, the Laue condition will be satisfied (for a certain wavelength in the interval (l m ¸ l min)) and, consequently, a diffraction maximum appears - a reflection on the film. For shooting according to the Laue method, a RKSO camera is used (Fig. 2).

Rice. 2 Chamber RKSO
Here, the primary X-ray beam is cut out by aperture 1 with two holes 0.5–1.0 mm in diameter. The aperture size of the diaphragm is chosen so that the cross section of the primary beam is greater than the cross section of the crystal under study. Crystal 2 is mounted on goniometric head 3, which consists of a system of two mutually perpendicular arcs. The crystal holder on this head can move relative to these arcs, and the goniometric head itself can be rotated through any angle around an axis perpendicular to the primary beam. The goniometric head makes it possible to change the orientation of the crystal with respect to the primary beam and set a certain crystallographic direction of the crystal along this beam. The diffraction pattern is recorded on photographic film 4 placed in a cassette, the plane of which is perpendicular to the primary beam. On the cassette in front of the film is a thin wire stretched parallel to the axis of the goniometric head. The shadow of this wire makes it possible to determine the orientation of the film with respect to the axis of the goniometric head. If sample 2 is placed in front of film 4, then the X-ray patterns obtained in this way are called Laue patterns. The diffraction pattern recorded on a photographic film located in front of the crystal is called an epigram. On Lauegrams, diffraction spots are located along zonal curves (ellipses, parabolas, hyperbolas, straight lines). These curves are plane sections of the diffraction cones and touch the primary spot. On epigrams, diffraction spots are located along hyperbolas that do not pass through the primary beam.
To consider the features of the diffraction pattern in the Laue method, a geometric interpretation is used using a reciprocal lattice. Lauegrams and epigrams are a reflection of the reciprocal lattice of a crystal. The gnomonic projection constructed according to the Lauegram makes it possible to judge the mutual arrangement of the normals to the reflecting planes in space and to get an idea of the symmetry of the crystal reciprocal lattice. The shape of the Lauegram spots is used to judge the degree of perfection of the crystal. A good crystal gives clear spots on the Lauegram. The symmetry of crystals according to the Lauegram is determined by relative position spots (the symmetrical arrangement of the atomic planes must correspond to the symmetrical arrangement of the reflected rays). (See fig. 3)

Rice. Fig. 3 Scheme of taking X-ray images according to the Laue method (a - in transmission, b - in reflection, F - focus of the X-ray tube, K - aperture, O - sample, Pl - film)
The rotation method is the main one in determining the atomic structure of crystals. This method determines the size of the unit cell, the number of atoms or molecules per cell. The space group is found from the extinction of the reflections (accurate to the center of inversion). Data from the measurement of the intensity of the diffraction peaks are used in calculations related to the determination of the atomic structure. When taking X-ray images by the rotation method, the crystal rotates or oscillates around a certain crystallographic direction when it is irradiated with monochromatic or characteristic X-rays. The primary beam is cut out by a diaphragm (with two round holes) and enters the crystal. The crystal is mounted on the goniometric head so that one of its important directions (such as , , ) is oriented along the axis of rotation of the goniometric head. The goniometric head is a system of two mutually perpendicular arcs, which allows you to set the crystal at the desired angle with respect to the axis of rotation and to the primary x-ray beam. The goniometric head is driven into slow rotation through a system of gears with the help of a motor. The diffraction pattern is recorded on a photographic film located along the axis of the cylindrical surface of a cassette of a certain diameter (86.6 or 57.3 mm).
In the absence of an external cut, the crystals are oriented by the Laue method. For this purpose, it is possible to install a cassette with a flat film in the rotation chamber. The diffraction maxima on the X-ray pattern of rotation are located along straight lines, called layer lines. The maxima on the radiograph are located symmetrically with respect to the vertical line passing through the primary spot. Rotational X-ray diffraction patterns often show continuous bands passing through diffraction maxima. The appearance of these bands is due to the presence of a continuous spectrum in the X-ray tube radiation along with the characteristic spectrum.
When the crystal rotates around the main crystallographic direction, the reciprocal lattice associated with it rotates. When the nodes of the reciprocal lattice cross the propagation sphere, diffraction rays arise, which are located along the generatrix of the cones, the axes of which coincide with the axis of rotation of the crystal. All nodes of the reciprocal lattice intersected by the propagation sphere during its rotation constitute the effective region, i.e. determine the region of indices of diffraction maxima arising from a given crystal during its rotation. To establish the atomic structure of a substance, it is necessary to indicate the X-ray patterns of rotation. Indexing is usually done graphically using reciprocal lattice representations. The rotation method determines the crystal lattice periods, which, together with the angles determined by the Laue method, make it possible to find the unit cell volume. Using density data, chemical composition and the unit cell volume, find the number of atoms in the unit cell.
In the usual method of studying polycrystalline materials, a thin column of ground powder or other fine-grained material is illuminated with a narrow beam of X-rays with a certain wavelength. The ray diffraction pattern is fixed on a narrow strip of photographic film rolled up in the form of a cylinder, along the axis of which the sample under study is located. Relatively less common is shooting on flat photographic film.
The schematic diagram of the method is given in fig. 4.

Rice. 4 Schematic diagram of powder shooting:
1 - diaphragm; 2 - the place of entry of rays;
3 - sample: 4 - place where the rays exit;
5 - camera body; 6 - (photographic film)
When a beam of monochromatic rays is incident on a sample consisting of many small crystals with various orientations, then the sample will always contain a known number of crystals, which will be located in such a way that some groups of planes will form an angle q with the incident beam, which satisfies the conditions of reflection.
X-ray structural analysis methods for studying the structure of matter by distribution in space and intensities of X-ray radiation scattered on the analyzed object. R. s. a. along with neutron diffraction (See Neutron diffraction) and electron diffraction (See Electron diffraction) is a diffraction structural method; it is based on the interaction of X-rays with the electrons of matter, which results in X-ray diffraction. The diffraction pattern depends on the wavelength of the X-rays used (See X-rays) and the structure of the object. To study the atomic structure, radiation with a wavelength X-ray structural analysis of 1 Å, i.e., of the order of the size of atoms, is used. R.'s methods with. a. study metals, alloys, minerals, inorganic and organic compounds, polymers, amorphous materials, liquids and gases, protein molecules, nucleic acids, etc. Most successfully R. with. a. used to establish the atomic structure of crystalline bodies. This is due to the fact that Crystals have a strict periodicity in their structure and represent a diffraction grating for X-rays created by nature itself. History reference. The diffraction of X-rays by crystals was discovered in 1912 by the German physicists M. Laue, W. Friedrich, and P. Knipping. Directing a narrow beam of X-rays at a stationary crystal, they registered a diffraction pattern on a photographic plate placed behind the crystal, which consisted of a large number regular spots. Each spot is a trace of a diffraction beam scattered by the crystal. radiograph ,
obtained by this method is called the Lauegram (See Lauegram) ( rice. one
). The theory of X-ray diffraction on crystals developed by Laue made it possible to relate the wavelength λ of radiation, the parameters of the unit cell of the crystal a, b, c(see Crystal lattice) ,
angles of the incident (α 0 , β 0 , γ 0) and diffraction (α, β, γ) beams by the ratios: a(cosα - cosα 0) = hλ ,
b(cosβ - cosβ 0) = kλ, (1) c(cosγ - cosγ 0) = lλ ,
In the 50s. R.'s methods of page began to develop rapidly. a. with the use of computers in the technique of the experiment and in the processing of x-ray diffraction information. Experimental methods R. with. a. X-ray cameras and X-ray diffractometers are used to create conditions for diffraction and registration of radiation. The scattered X-ray radiation in them is recorded on photographic film or measured by nuclear radiation detectors. Depending on the state of the sample being studied and its properties, as well as on the nature and amount of information that must be obtained, various methods of R. s are used. a. Single crystals selected for the study of the atomic structure must have dimensions X-ray structural analysis 0.1 mm and, if possible, have a perfect structure. The study of defects in relatively large, almost perfect crystals is carried out by X-ray topography, which is sometimes referred to as X-ray topography. a. Laue method - simplest method obtaining radiographs from single crystals. The crystal in Laue's experiment is stationary, and the X-rays used have a continuous spectrum. Location of diffraction spots on the Laue patterns ( rice. one
) depends on the symmetry of the crystal and its orientation with respect to the incident beam. The Laue method makes it possible to establish whether a crystal under study belongs to one and 11 Laue symmetry groups and to orient it (i.e., determine the direction of the crystallographic axes) with an accuracy of several arc minutes. By the nature of the spots on the Lauegrams, and especially by the appearance of Asterism a, one can reveal internal stresses and some other defects in the crystal structure. The Laue method checks the quality of single crystals when choosing a sample for its more complete structural study. Sample rocking and rotation methods are used to determine the repeat periods (lattice constant) along the crystallographic direction in a single crystal. They allow, in particular, to set parameters a, b, c unit cell of a crystal. This method uses monochromatic X-ray radiation, the sample is brought into oscillatory or rotational motion around an axis coinciding with the crystallographic direction, along which the repeat period is examined. The spots on the rocking and rotation radiographs obtained in cylindrical cassettes are located on a family of parallel lines. The distances between these lines, the radiation wavelength, and the diameter of the X-ray camera cassette make it possible to calculate the required repetition period in the crystal. The Laue conditions for diffraction rays in this method are satisfied by changing the angles included in relations (1) during rocking or rotation of the sample. X-ray methods. For a complete study of the structure of a single crystal by X-ray methods. a. it is necessary not only to establish the position, but also to measure the intensities of as many diffraction reflections as possible, which can be obtained from the crystal at a given radiation wavelength and all possible orientations of the sample. To do this, the diffraction pattern is recorded on photographic film in an X-ray goniometer (See X-ray goniometer) and measured using a Microphotometer a
the degree of blackening of each spot on the x-ray. In an X-ray diffractometer, one can directly measure the intensity of diffraction reflections using proportional, scintillation, and other X-ray photon counters. To have a complete set of reflections, X-ray goniometers take a series of X-ray patterns. On each of them, diffraction reflections are recorded, on the Miller indices of which certain restrictions are imposed (for example, reflections of the type hk 0, hk 1
etc.). Most often, an X-ray goniometric experiment is performed using the Weisenberg methods. Burger ( rice. 2
) and de Jong-Bowman. The same information can be obtained with the help of rocking radiographs. To establish an atomic structure of medium complexity (X-ray structural analysis of 50-100 atoms in a unit cell), it is necessary to measure the intensities of several hundreds and even thousands of diffraction reflections. This very time-consuming and painstaking work is performed by automatic microdensitometers and computer-controlled diffractometers, sometimes for several weeks or even months (for example, in the analysis of protein structures, when the number of reflections increases to hundreds of thousands). By using several counters in the diffractometer, which can record reflections in parallel, the time of the experiment can be significantly reduced. Diffractometric measurements are superior to photographic recording in terms of sensitivity and accuracy. Method for the study of polycrystals (Debye - Scherrer method). Metals, alloys, crystalline powders consist of many small single crystals of a given substance. For their study, monochromatic radiation is used. The X-ray pattern (Debyegram) of polycrystals consists of several concentric rings, each of which merges reflections from a certain system of planes of differently oriented single crystals. Debyegrams of various substances have individual character and are widely used to identify compounds (including those in mixtures). R.s.a. polycrystals allows you to determine the phase composition of the samples, determine the size and preferred orientation (texturing) of grains in the substance, control the stresses in the sample and solve other technical problems. Study of amorphous materials and partially ordered objects. A clear X-ray pattern with sharp diffraction maxima can only be obtained with a complete three-dimensional periodicity of the sample. The lower the degree of ordering of the atomic structure of the material, the more blurred, diffuse character is the X-ray radiation scattered by it. The diameter of a diffuse ring in an X-ray diffraction pattern of an amorphous substance can serve as a rough estimate of the average interatomic distances in it. With an increase in the degree of order (see Long-Range Order and Short-Range Order) in the structure of objects, the diffraction pattern becomes more complicated and, consequently, contains more structural information. The small-angle scattering method makes it possible to study the spatial inhomogeneities of a substance, the dimensions of which exceed the interatomic distances, i.e. range from 5-10 Å to X-ray structural analysis 10,000 Å. The scattered X-ray radiation in this case is concentrated near the primary beam - in the region of small scattering angles. Small-angle scattering is used to study porous and finely dispersed materials, alloys and complex biological objects: viruses, cell membranes, chromosomes. For isolated protein molecules and nucleic acids, the method allows determining their shape, size, molecular weight; in viruses - the nature of the mutual stacking of their components: protein, nucleic acids, lipids; in synthetic polymers - packing of polymer chains; in powders and sorbents - the distribution of particles and pores by size; in alloys - the occurrence and size of phases; in textures (in particular, in liquid crystals) - the form of packing of particles (molecules) into various kinds of supramolecular structures. The X-ray small-angle method is also used in industry to control the processes of manufacturing catalysts, fine coals, etc. Depending on the structure of the object, measurements are made for scattering angles from fractions of a minute to several degrees. Determination of the atomic structure from X-ray diffraction data. Deciphering the atomic structure of a crystal includes: establishing the size and shape of its elementary cell; determination of whether a crystal belongs to one of the 230 Fedorov (discovered by E. S. Fedorov (see Fedorov)) crystal symmetry groups (see Crystal symmetry); obtaining the coordinates of the basic atoms of the structure. The first and partially second problems can be solved by the Laue methods and rocking or rotation of the crystal. It is possible to finally establish the symmetry group and coordinates of the basic atoms of complex structures only with the help of complex analysis and laborious mathematical processing of the intensity values of all diffraction reflections from a given crystal. The ultimate goal of such processing is to calculate the values of the electron density ρ( x, y, z)
at any point of the crystal cell with coordinates x, y, z. The periodicity of the crystal structure allows us to write the electron density in it through the Fourier series :
where V- unit cell volume, Fhkl- Fourier coefficients, which in R. s. a. are called structural amplitudes, i= hkl and is related to the diffraction reflection, which is determined by conditions (1). The purpose of summation (2) is to mathematically assemble the X-ray diffraction reflections to obtain an image of the atomic structure. To produce in this way image synthesis in R. s. a. This is due to the lack of lenses for x-rays in nature (in visible light optics, a converging lens serves for this). Diffraction reflection is a wave process. It is characterized by an amplitude equal to ∣ Fhkl∣, and phase α hkl(by the phase shift of the reflected wave with respect to the incident), through which the structural amplitude is expressed: Fhkl=∣Fhkl∣(cosα hkl +i sinα hkl). The diffraction experiment makes it possible to measure only reflection intensities proportional to ∣ Fhkl∣ 2 , but not their phases. Phase determination is the main problem in deciphering the crystal structure. The determination of the phases of structural amplitudes is fundamentally the same for both crystals consisting of atoms and for crystals consisting of molecules. Having determined the coordinates of atoms in a molecular crystalline substance, it is possible to isolate its constituent molecules and establish their size and shape. It is easy to solve the problem that is the reverse of the structural interpretation: the calculation of the known atomic structure of structural amplitudes, and from them - the intensities of diffraction reflections. The trial and error method, historically the first method of deciphering structures, consists in comparing experimentally obtained ∣ Fhkl∣ exp, with values calculated on the basis of the trial model ∣ Fhkl∣ calc. Depending on the value of the divergence factor A fundamentally new way to deciphering the atomic structures of single crystals was opened by the use of the so-called. Paterson functions (functions of interatomic vectors). To construct the Paterson function of some structure consisting of N atoms, we move it parallel to itself so that the first atom hits the fixed origin first. Vectors from the origin to all atoms of the structure (including a vector of zero length to the first atom) will indicate the position N maxima of the function of interatomic vectors, the totality of which is called the image of the structure in the atom 1.
Let's add more to them N maxima, the position of which will indicate N vectors from the second atom placed at the parallel transfer of the structure to the same origin. After doing this procedure with all N atoms ( rice. 3
), we'll get N 2 vectors. The function describing their position is the Paterson function. For the Paterson function R(u, υ, ω)
(u, υ, ω - coordinates of points in the space of interatomic vectors), one can obtain the expression: from which it follows that it is determined by the moduli of structural amplitudes, does not depend on their phases, and, therefore, can be calculated directly from the data of a diffraction experiment. Difficulty in interpreting a function R(u, υ, ω) consists in the need to find the coordinates N atoms from N 2 her
maxima, many of which merge due to overlaps that arise when constructing the function of interatomic vectors. The easiest to decrypt R(u, υ, ω) the case when the structure contains one heavy atom and several light ones. The image of such a structure in a heavy atom will differ significantly from other images of it. Among the various methods that make it possible to determine the model of the structure under study by the Paterson function, the most effective were the so-called superposition methods, which made it possible to formalize its analysis and perform it on a computer. Methods of the Paterson function encounter serious difficulties in studying the structures of crystals consisting of identical or similar atoms in atomic number. In this case, the so-called direct methods for determining the phases of structural amplitudes turned out to be more effective. Taking into account the fact that the value of the electron density in a crystal is always positive (or equal to zero), one can obtain a large number of inequalities to which the Fourier coefficients (structural amplitudes) of the function ρ( x, y, z). Using the methods of inequalities, it is relatively easy to analyze structures containing up to 20–40 atoms in the unit cell of a crystal. For more complex structures, methods based on a probabilistic approach to the problem are used: structural amplitudes and their phases are considered as random variables; distribution functions of these random variables, which make it possible to estimate, taking into account the experimental values of the moduli of structural amplitudes, the most probable values of the phases. These methods are also implemented on a computer and make it possible to decipher structures containing 100–200 or more atoms in a unit cell of a crystal. So, if the phases of the structural amplitudes are established, then the electron density distribution in the crystal can be calculated from (2), the maxima of this distribution correspond to the position of the atoms in the structure ( rice. 4
). The final refinement of the coordinates of atoms is carried out on a computer Least squares method om
and, depending on the quality of the experiment and the complexity of the structure, it makes it possible to obtain them with an accuracy of up to thousandths of an Å (with the help of a modern diffraction experiment, one can also calculate the quantitative characteristics of thermal vibrations of atoms in a crystal, taking into account the anisotropy of these vibrations). R. s. a. makes it possible to establish more subtle characteristics of atomic structures, for example, the distribution of valence electrons in a crystal. However, this complex problem has so far been solved only for the simplest structures. For this purpose, a combination of neutron diffraction and X-ray diffraction studies is very promising: neutron diffraction data on the coordinates of atomic nuclei are compared with the spatial distribution of the electron cloud obtained using X-ray diffraction. a. To solve many physical and chemical problems, X-ray diffraction studies and resonance methods are jointly used. The pinnacle of R.'s achievements. a. - deciphering the three-dimensional structure of proteins, nucleic acids and other macromolecules. Proteins in vivo usually do not form crystals. To achieve a regular arrangement of protein molecules, proteins are crystallized and then their structure is examined. The phases of the structural amplitudes of protein crystals can only be determined as a result of the joint efforts of radiographers and biochemists. To solve this problem, it is necessary to obtain and study crystals of the protein itself, as well as its derivatives with the inclusion of heavy atoms, and the coordinates of the atoms in all these structures must coincide. About numerous applications of methods of R. of page. a. to study various violations of the structure of solids under the influence of various influences, see Art. Radiography of materials. Lit.: Belov N.V., Structural crystallography, Moscow, 1951; Zhdanov G. S., Fundamentals of X-ray diffraction analysis, M. - L., 1940; James R., Optical principles of X-ray diffraction, trans. from English, M., 1950; Boky G. B., Poray-Koshits M. A., X-ray analysis, M., 1964; Poray-Koshits M.A., Practical course X-ray diffraction analysis, M., 1960: Kitaigorodsky A.I., Theory of structural analysis, M., 1957; Lipeon G., Cochran V., Determination of the structure of crystals, trans. from English, M., 1961; Weinshtein B.K., Structural electron diffraction, M., 1956; Bacon, J., Neutron Diffraction, trans. from English, M., 1957; Burger M., Structure of crystals and vector space, transl. from English, M., 1961; Guinier A., X-ray diffraction of crystals, trans. from French, Moscow, 1961; Woolfson M. M., An introduction to X-ray crystallography, Camb., 1970: Ramachandran G. N., Srinivasan R., Fourier methode in crystallography, N. Y., 1970; Crystallographic computing, ed. F. R. Ahmed, Cph., 1970; Stout G. H., Jensen L. H., X-ray structure determination, N. Y. - L., . V. I. Simonov. Rice. 9. a. Projection onto the ab plane of the function of interatomic vectors of the mineral baotite O 16 Cl]. The lines are drawn through the same intervals of values of the function of interatomic vectors (lines of equal level). b. The projection of the electron density of baotite onto the ab plane, obtained by deciphering the function of interatomic vectors (a). The electron density maxima (clumps of lines of equal level) correspond to the positions of atoms in the structure. in. Image of a model of the atomic structure of baotite. Each Si atom is located inside a tetrahedron formed by four O atoms; Ti and Nb atoms in octahedrons composed of O atoms. SiO 4 tetrahedra and Ti(Nb)O 6 octahedra in the baotite structure are connected as shown in the figure. Part of the unit cell of the crystal corresponding to Fig. a and b are marked with a dashed line. Dotted lines in fig. a and b determine the zero levels of the values of the corresponding functions. Physical Encyclopedia - X-RAY STRUCTURAL ANALYSIS, study of the atomic structure of a sample of a substance according to the X-ray diffraction pattern on it. Allows you to establish the distribution of the electron density of a substance, which determines the type of atoms and their ... ... Illustrated Encyclopedic Dictionary - (X-ray diffraction analysis), a set of methods for studying the atomic structure of a substance using X-ray diffraction. According to the diffraction pattern, the distribution of the electron density of the substance is established, and according to it the type of atoms and their ... ... encyclopedic Dictionary - (X-ray structural analysis), research method atomic mol. buildings in c, ch. arr. crystals, based on the study of diffraction arising from the interaction. with the test sample of X-ray radiation of a wavelength of approx. 0.1 nm. Use Ch. arr… Chemical Encyclopedia - (see X-RAY STRUCTURAL ANALYSIS, NEUTRONOGRAPHY, ELECTRONOGRAPHY). Physical Encyclopedic Dictionary. Moscow: Soviet Encyclopedia. Editor-in-Chief A. M. Prokhorov. 1983... Physical Encyclopedia Determination of the structure in in and materials, i.e., finding out the location in space of their constituent structural units (molecules, ions, atoms). In the narrow sense, S. a. determination of the geometry of molecules and mol. systems, which are usually described by a set of lengths ... ... Chemical Encyclopedia
Three methods are mainly used in X-ray diffraction analysis:
1.Laue method. In this method, a radiation beam with a continuous spectrum is incident on a stationary single crystal. The diffraction pattern is recorded on a still photographic film.
2. Single crystal rotation method. A beam of monochromatic radiation is incident on a crystal rotating (or oscillating) around a certain crystallographic direction. The diffraction pattern is recorded on a still photographic film. In a number of cases, the film moves synchronously with the rotation of the crystal; this variation of the rotation method is called the layered line sweep method.
3. Method of powders or polycrystals (Debye-Scherrer-Hull method). This method uses a monochromatic beam of rays. The sample consists of a crystalline powder or is a polycrystalline aggregate.
The Kossel method is also used - a stationary single crystal is removed in a widely divergent beam of monochromatic characteristic radiation.
Laue method.
The Laue method is used at the first stage of studying the atomic structure of crystals. It is used to determine the syngony of the crystal and the Laue class (the Friedel crystal class up to the center of inversion). According to Friedel's law, it is never possible to detect the absence of a center of symmetry on a Lauegram, and therefore adding a center of symmetry to the 32 crystal classes reduces their number to 11. The Laue method is mainly used to study single crystals or coarse-grained samples. In the Laue method, a stationary single crystal is illuminated by a parallel beam of rays with a continuous spectrum. The sample can be either an isolated crystal or a fairly large grain in a polycrystalline aggregate. The formation of a diffraction pattern occurs during the scattering of radiation with wavelengths from l min \u003d l 0 \u003d 12.4 / U, where U is the voltage on the X-ray tube, to l m - the wavelength that gives the intensity of the reflection (diffraction maximum) exceeding the background at least by 5 %. lm depends not only on the intensity of the primary beam (atomic number of the anode, voltage and current through the tube), but also on the absorption of X-rays in the sample and the film cassette. The spectrum l min - l m corresponds to a set of Ewald spheres with radii from 1/ l m to 1/l min , which touch the node 000 and OR of the crystal under study (Fig. 1).
Then, for all OR nodes lying between these spheres, the Laue condition will be satisfied (for a certain wavelength in the interval (l m ¸ l min)) and, consequently, a diffraction maximum appears - a reflection on the film. For shooting according to the Laue method, a RKSO camera is used (Fig. 2).
Here, the primary X-ray beam is cut out by aperture 1 with two holes 0.5–1.0 mm in diameter. The aperture size of the diaphragm is chosen so that the cross section of the primary beam is greater than the cross section of the crystal under study. Crystal 2 is mounted on goniometric head 3, which consists of a system of two mutually perpendicular arcs. The crystal holder on this head can move relative to these arcs, and the goniometric head itself can be rotated through any angle around an axis perpendicular to the primary beam. The goniometric head makes it possible to change the orientation of the crystal with respect to the primary beam and set a certain crystallographic direction of the crystal along this beam. The diffraction pattern is recorded on photographic film 4 placed in a cassette, the plane of which is perpendicular to the primary beam. On the cassette in front of the film is a thin wire stretched parallel to the axis of the goniometric head. The shadow of this wire makes it possible to determine the orientation of the film with respect to the axis of the goniometric head. If the sample 2 is located in front of the film 4, then the X-ray patterns obtained in this way are called Laue patterns. The diffraction pattern recorded on a photographic film located in front of the crystal is called an epigram. On Lauegrams, diffraction spots are located along zonal curves (ellipses, parabolas, hyperbolas, straight lines). These curves are plane sections of the diffraction cones and touch the primary spot. On epigrams, diffraction spots are located along hyperbolas that do not pass through the primary beam. To consider the features of the diffraction pattern in the Laue method, a geometric interpretation is used using a reciprocal lattice. Lauegrams and epigrams are a reflection of the reciprocal lattice of a crystal. The gnomonic projection constructed according to the Lauegram makes it possible to judge the mutual arrangement of the normals to the reflecting planes in space and to get an idea of the symmetry of the crystal reciprocal lattice. The shape of the Lauegram spots is used to judge the degree of perfection of the crystal. A good crystal gives clear spots on the Lauegram. The symmetry of crystals according to the Lauegram is determined by the mutual arrangement of spots (the symmetrical arrangement of atomic planes must correspond to the symmetrical arrangement of reflected rays).
Fig.2 
Fig.3 
Single crystal rotation method.
The rotation method is the main one in determining the atomic structure of crystals. This method determines the size of the unit cell, the number of atoms or molecules per cell. The space group is found from the extinction of the reflections (accurate to the center of inversion). Data from the measurement of the intensity of the diffraction peaks are used in calculations related to the determination of the atomic structure.
When taking X-ray images by the rotation method, the crystal rotates or oscillates around a certain crystallographic direction when it is irradiated with monochromatic or characteristic X-rays. The scheme of the camera for shooting by the method of rotation is shown in Fig.1.
The primary beam is cut out by diaphragm 2 (with two round holes) and falls on crystal 1. The crystal is mounted on goniometric head 3 so that one of its important directions (such as , [ 010], ) is oriented along the axis of rotation of the goniometric head. The goniometric head is a system of two mutually perpendicular arcs, which allows you to set the crystal at the desired angle with respect to the axis of rotation and to the primary x-ray beam. The goniometric head is driven into slow rotation through a system of gears using a motor 4. The diffraction pattern is recorded on photographic film 5 located along the axis of the cylindrical surface of a cassette of a certain diameter (86.6 or 57.3 mm). In the absence of an external cut, the crystals are oriented by the Laue method; for this purpose, a cassette with a flat film is provided in the rotation chamber.
The diffraction maxima on the X-ray pattern of rotation are located along straight lines, called layer lines.
The maxima on the radiograph are located symmetrically with respect to the vertical line passing through the primary spot (dotted line in Figure 2). Rotational X-ray diffraction patterns often show continuous bands passing through diffraction maxima. The appearance of these bands is due to the presence of a continuous spectrum in the X-ray tube radiation along with the characteristic spectrum. When a crystal rotates around the main (or important) crystallographic direction, the reciprocal lattice associated with it rotates. When the nodes of the reciprocal lattice cross the propagation sphere, diffraction rays arise, which are located along the generatrix of the cones, the axes of which coincide with the axis of rotation of the crystal. All nodes of the reciprocal lattice intersected by the propagation sphere during its rotation constitute the effective region, i.e. determine the region of indices of diffraction maxima arising from a given crystal during its rotation. To establish the atomic structure of a substance, it is necessary to indicate the X-ray patterns of rotation. Indexing is usually done graphically using reciprocal lattice representations. The rotation method determines the crystal lattice periods, which, together with the angles determined by the Laue method, make it possible to find the unit cell volume. Using data on the density, chemical composition and volume of the unit cell, the number of atoms in the unit cell is found.
Fig.1 
Fig.2 
Method of powders (polycrystals).
The powder method is used to obtain a diffraction pattern from polycrystalline substances in the form of a powder or a massive sample (polycrystal) with a flat microsection surface. When samples are illuminated with monochromatic or characteristic X-ray radiation, a distinct interference effect appears in the form of a system of coaxial Debye cones, the axis of which is the primary beam (Fig. 1).
The diffraction conditions are satisfied for those crystals in which the (hkl) planes form an angle q with the incident radiation. The lines of intersection of the Debye cones with the film are called Debye rings. To register an interference pattern in the powder method, several methods are used to position the film in relation to the sample and the primary x-ray beam: shooting on flat, cylindrical, and cone film. Registration can also be done using counters. For this purpose, a diffractometer is used.
With the photographic method of registering an interference pattern, several types of surveys are used:
1.
Flat film. There are two ways to position the film: front and rear (reverse) shooting. In front shooting, the sample is placed in front of the film with respect to the direction of the primary beam of rays. A number of concentric circles are recorded on the film, which correspond to the intersection with the plane of the film of interference cones with an opening angle q< 3 0 0 . Измерив диаметр колец, зарегистрированных на пленке, можно определить угол q для соответствующих интерференционных конусов. Недостатком такого способа съемки является то, что на фотопленке регистрируется только небольшое число дифракционных колец. Поэтому переднюю съемку на плоскую пленку применяют в основном для исследования текстур, при котором необходимо определить распределение интенсивности по полному дифракционному кольцу. При задней съемке образец располагается по отношению к пучку рентгеновских лучей сзади пленки. На пленке регистрируются максимумы, отвечающие углу q >3 0 0 . Reverse shooting is used for accurate determinations of periods and for measuring internal stresses.
2. Cylindrical film.
The axis of the cylinder along which the film is located is perpendicular to the primary beam (Fig. 2).
The angle q is calculated from the measurement of the distances between the lines 2 l, corresponding to the same interference cone, according to the relations:
2l = 4qR; q = (l/ 2R) (180 0 / p),
where R is the radius of the cylindrical cassette along which the film was placed. In a cylindrical camera, the film can be placed in several ways - symmetrical and asymmetric ways of loading the film. With the symmetrical charging method, the ends of the film are located near the diaphragm, through which the beam of primary rays enters the chamber. To exit this beam from the chamber, a hole is made in the film. The disadvantage of this method of charging is that during photo processing the film is reduced in length, as a result of which, when calculating the X-ray pattern, one should use not the value of the radius R along which the film was located during the shooting, but a certain value R eff. R eff. is determined by shooting a reference substance with known lattice periods. According to the known period of the grating of the standard, theoretically the reflection angles q calc are determined. , from the values of which, in combination with the distances between the symmetrical lines measured from the X-ray diffraction pattern, determine the value of R eff.
With an asymmetric method of loading the film, the ends of the film are placed at an angle of 90 0 with respect to the primary beam (two holes are made in the film for the entry and exit of the primary beam beam). In this way, R eff. determined without taking the standard. To do this, measure the distances A and B between the symmetrical lines on the radiograph (Fig. 3):
R eff. \u003d (A + B) / 2p;
A general view of the Debye camera for shooting debyegrams is shown in Figure 4.
The cylindrical body of the camera is mounted on a stand 3, equipped with three set screws. The axis of the cylinder is horizontal. The sample (thin column) is placed in holder 1, which is fixed in the chamber with a magnet. The centering of the sample when installing it in the holder is carried out in the field of view of a special mounting microscope with low magnification. The photographic film is placed on the inner surface of the housing, pressed with special spacer rings fixed on the inner side of the chamber cover 4. The X-ray beam washing the sample enters the camera through collimator 2. Since the primary beam, falling directly on the film behind the sample, veils the X-ray pattern, it intercepted on the way to the film by a trap. To eliminate the dottedness of the rings on the X-ray diffraction pattern of a coarse-grained sample, it is rotated during shooting. The collimator in some cameras is made in such a way that by inserting lead or brass circles (screens) with holes into special grooves in front and behind it, you can cut out a beam of rays of a round or rectangular cross section (round and slit diaphragms). The dimensions of the apertures of the diaphragm should be chosen so that the beam of rays washes the sample. Typically, cameras are made so that the diameter of the film in it is a multiple of 57.3 mm (ie 57.3; 86.0; 114.6 mm). Then the calculation formula for determining the angle q, deg, is simplified. For example, for a standard Debye chamber with a diameter of 57.3 mm, q i = 2l/2. Before proceeding to the determination of interplanar distances using the Wulf-Bragg formula:
2 d sin q = n l ,
It should be taken into account that the position of the lines on the X-ray diffraction pattern from the column slightly changes depending on the radius of the sample. The fact is that due to the absorption of X-rays, a thin surface layer of the sample, and not its center, participates in the formation of the diffraction pattern. This leads to a shift of the symmetrical pair of lines by:
D r = r cos 2 q , where r is the sample radius.
Then: 2 l i = 2 l meas. ± D 2l - D r.
Correction D 2l associated with a change in the distance between a pair of lines due to film shrinkage during photo processing is tabulated in reference books and textbooks on X-ray diffraction analysis. According to the formula q i \u003d 57.3 (l / 2 R eff.). After determining q i, sinq i is found and the interplanar distance is determined from them for lines obtained in K a - radiation:
(d/n) i = l K a / 2 sin q i K a .
To separate the lines obtained by diffraction from the same radiation planes l K b , filtered characteristic radiation is used or a calculation is carried out in this way. As:
d / n \u003d l K a / 2 sin q a \u003d l K b / 2 sin q b;
sin q a / sin q b \u003d l K a / l K b " 1.09, whence sinq a \u003d 1.09 sinq b.
In the sinq series, find the values corresponding to the most intense reflections. Next, there is a line for which sinq is equal to the calculated value, and its intensity is 5-7 times less. This means that these two lines arose due to the reflection of rays Ka and Kb, respectively, from planes with the same distance d/n.
Determining the periods of crystal lattices is associated with some errors, which are associated with inaccurate measurements of the Wolf-Bragg angle q. High accuracy in determining the periods (error 0.01-0.001%) can be achieved by using special methods of capturing and processing the results of measuring radiographs, the so-called precision methods. Achieving maximum accuracy in determining the lattice periods is possible by the following methods:
1. using the values of interplanar distances determined from the angles in the precision region;
2. a decrease in error as a result of the use of precise experimental techniques;
3. using methods of graphical or analytical extrapolation.
The minimum error D d/d is obtained when measuring at angles q = 80¸ 83 0 . Unfortunately, not all substances give lines at such large angles on the x-ray. In this case, a line at the largest possible angle q should be used for measurements. An increase in the accuracy of determining cell parameters is also associated with a decrease in random errors, which can only be taken into account by averaging, and taking into account systematic errors, which can be taken into account if the causes of their occurrence are known. Accounting for systematic errors in determining the lattice parameters is reduced to finding the dependence of systematic errors on the Bragg angle q , which allows extrapolation to angles q = 90 0 , at which the error in determining interplanar distances becomes small. Random errors are.
It is a method for studying the structural structure of substances. It is based on the diffraction of an X-ray beam on special three-dimensional crystal lattices. In the study, they use which is approximately 1A, which corresponds to the size of an atom. It must be said that X-ray diffraction analysis, together with neutron and electron diffraction, belongs to diffraction methods for determining the structure of a substance under study.
It helps to explore the atomic structure, space groups, its size and shape, as well as the symmetry group of crystals. Using this technique, metals and their various alloys, organic and inorganic compounds, minerals, amorphous materials, liquids, and gases are studied. In some cases, X-ray diffraction analysis of proteins, nucleic acids and other substances is used.
This analysis helps to establish atomic materials that have a well-defined structure and are natural for x-rays. It should be noted that in the study of other substances, X-ray diffraction analysis requires the presence of crystals, which is an important but rather difficult task.

Discovered by Laue, the theoretical foundations developed by Wolfe and Bragg. Debye and Scherrer suggested using the discovered regularities in the role of analysis. It must be said that at present, X-ray diffraction analysis remains one of the most common methods for determining the structure of substances, since it is simple to perform and does not require significant material costs.
It allows you to explore different classes of substances, and the value of the information obtained determines the introduction of new techniques. So, at first they began to study using the function of interatomic vectors, later direct methods for determining the crystal structure were developed. It is worth noting that the first substances that were studied using X-rays were sodium and potassium chlorides.

The study of the spatial began in the 30s of the last century in Great Britain. The data obtained gave rise to molecular biology, which made it possible to reveal important physicochemical properties of proteins, as well as to create the first model of DNA.
Since the 1950s, computer methods for assembling information that was obtained from X-ray structural analysis began to actively develop.
Today, synchrotrons are used. They are monochrome sources that are used to irradiate crystals. These devices are most effective when using the method of multiwave anomalous dispersion. It should be noted that they are used only in state scientific centers. Laboratories use a less powerful technique, which serves only to check the quality of crystals, as well as to obtain a rough analysis of substances.
X-RAY STRUCTURAL ANALYSIS(X-ray diffraction analysis) - methods for studying the atomic structure of matter by distribution in space and intensities of X-ray scattered on the analyzed object. . R. s. a. crystalline materials allows you to set the coordinates of atoms with an accuracy of 0.1-0.01 nm, determine the characteristics of these thermal atoms, including anisotropy and deviations from harmonics. law, receive on eksperim. . to data of distribution in space of density of valence electrons on chemical. bonds in crystals and molecules. These methods are used to study metals and alloys, minerals, inorganic. and organic compounds, proteins, nucleic acids, viruses. Specialist. R.'s methods with. a. allow to study polymers, amorphous materials, liquids, gases.
Among the diffraction methods for studying the atomic structure of matter R. s. a. is the naib. widespread and developed. Its capabilities are complemented by methods neutronography and electronography.Diffraction the picture depends on the atomic structure of the object under study, the nature and wavelength of the x-rays. radiation. To establish the atomic structure of matter Naib. efficient use of x-rays. radiation with a wavelength of ~ 10 nm or less, i.e., of the order of the size of atoms. Especially successfully and with high accuracy R.'s methods of page. a. explore the atomic structure of the crystal. objects, the structure of which has a strict periodicity, and they, thus, are natural. three-dimensional diffraction. grating for x-ray radiation.
History reference
At the heart of R. s. a. crystalline substances lies the doctrine of . In 1890 Russian. crystallographer E. S. Fedorov and German. mathematician A. Schonflis (A. Schonflis) completed the derivation of 230 space groups characterizing all possible ways of arranging atoms in crystals. X-ray diffraction. rays on crystals, which is experimental. R.'s foundation with. a., was discovered in 1912 by M. Laue (M. Laue) and his collaborators W. Friedrich and P. Knipping. The theory of X-ray diffraction developed by Laue. rays on crystals made it possible to relate the radiation wavelength, the linear dimensions of the unit cell of the crystal a, b, c, the angles of the incident and diffraction rays by the relations 
where h, k,l- whole numbers ( crystallographic indices). Relations (1) are called the Laue equations, their fulfillment is necessary for the occurrence of X-ray diffraction. rays on a crystal. The meaning of equations (1) is that between parallel beams, scattered atoms, corresponding to neighboring lattice sites, must be integer multiples.
In 1913, W. L. Bragg and G. V. Wulff showed that diffraction. x-ray the beam can be considered as a reflection of the incident beam from a certain crystallographic system. planes with interplanar spacing d: ![]() where is the angle between the reflecting plane and the diffraction. beam (Bragg angle). In 1913-14, W. G. and W. L. Braggi were the first to use X-ray diffraction. rays for experiments. verification of the atomic structure of crystals NaCl, Cu, diamond, etc., previously predicted by W. Barlow. In 1916, P. Debye and P. Scherrer proposed and developed diffraction. methods of X-ray diffraction studies of polycrystalline. materials ( Debye - Scherrera method).
where is the angle between the reflecting plane and the diffraction. beam (Bragg angle). In 1913-14, W. G. and W. L. Braggi were the first to use X-ray diffraction. rays for experiments. verification of the atomic structure of crystals NaCl, Cu, diamond, etc., previously predicted by W. Barlow. In 1916, P. Debye and P. Scherrer proposed and developed diffraction. methods of X-ray diffraction studies of polycrystalline. materials ( Debye - Scherrera method).
as a source of x-rays. radiation were used (and are still used) soldered x-rays. tubes with anodes from dec. metals and, therefore, with different corresponding characteristics. radiation - Fe (= 19.4 nm), Cu (= 15.4 nm), Mo (= 7.1 nm), Ag (= 5.6 nm). Later, an order of magnitude more powerful tubes with a rotating anode appeared; powerful, having a white (continuous) radiation spectrum source - X-ray. synchrotron radiation. With the help of a system of monochromators, it is possible to continuously change the synchretron X-ray used in the study. radiation, which is of fundamental importance when used in R. s. a. effects of anomalous scattering. As a radiation detector in R. s. a. serves as an x-ray. photographic film, to-ruyu displace scintillation and semiconductor detectors. Efficiency will be measured. systems has increased dramatically with the use of coordinate one-dimensional and two-dimensional detectors.
Quantity n quality of information obtained with the help of R. s. a., depend on the accuracy of measurements and processing of experiments. data. Diffraction processing algorithms. data are determined by the used approximation of the theory of interaction x-rays. radiation with matter. In the 1950s the use of computers in the technique of X-ray diffraction experiments and for processing experiments began. data. Completely created automated systems for the study of crystalline. materials, to-rye conduct an experiment, processing experiments. data, main procedures for constructing and refining the atomic model of the structure and, finally, graphic. presentation of research results. However, with the help of these systems, it is not yet possible to study automatically. mode crystals with pseudosymmetry, twin samples and crystals with other structural features.
Experimental Methods x-ray structural analysis
To implement the diffraction conditions (1) and register the position in space and the intensities of the diffracted X-ray. radiation serve as x-rays. cameras and x-rays. diffractometers with registration of radiation respectively photogr. methods or radiation detectors. The nature of the sample (single crystal or polycrystal, a sample with a partially ordered structure or an amorphous body, liquid or gas), its size, and the problem to be solved determine the required exposure and the accuracy of scattered X-ray recording. radiation and, consequently, a certain method of R. s. a. To study single crystals when used as a source of x-rays. sealed-off X-ray radiation. tube sufficient sample volume ~10 -3 mm 3 . To obtain high-quality diffraction picture, the sample must have the most perfect structure, and its blockiness does not interfere with structural studies. The real structure of large, almost perfect single crystals is investigated by x-ray topography, to-ruyu is sometimes also referred to as R. s. a.
Laue method- the simplest method for obtaining x-ray patterns of single crystals. The crystal in Laue's experiment is motionless, and the x-ray used. radiation has a continuous spectrum. The location of the diffraction spots on Lauegrams depends on the size of the unit cell and crystal symmetry, as well as on the orientation of the sample with respect to the incident x-ray. beam. The Laue method makes it possible to attribute a single crystal to one of the 11 Laue symmetry groups and to establish the orientation of its crystallographic. axes to within angular. minutes (see Laue method). By the nature of diffraction spots on the Lauegrams, and especially by the appearance of asterism (blurring of spots), it is possible to identify the internal. stresses and certain other structural features of the sample. The Laue method checks the quality of single crystals and selects the most. perfect samples for a more complete structural study (X-ray goniometric methods; see below).
Methods of rocking and rotation of the sample determine the periods of repetition (broadcast) along the given crystallographic. directions, check the symmetry of the crystal, and measure the intensity of the diffraction. reflections. The sample is vibrated during the experiment. or rotate. movement about an axis coinciding with one of the crystallographic. axes of the sample, to-ruyu previously oriented perpendicular to the incident X-ray. beam. Diffraction picture created by monochromatic. radiation, is registered on X-ray. film in a cylindrical cassette, the axis of which coincides with the axis of oscillation of the sample. Diffraction Spots with such shooting geometry on a developed film turn out to be located on a family of parallel lines (Fig. 1). Return period T along the crystallographic direction is:
where D- the diameter of the cassette, - the distance between the corresponding straight lines on the radiograph. Since it is constant, the Laue conditions (1) are satisfied by changing the angles during rocking or rotation of the sample. Usually on the x-ray patterns of rocking and rotation of the sample, diffraction. spots overlap. To avoid this unwanted effect, you can reduce the angle. sample oscillation amplitude. This technique is used, for example, in R. s. a. proteins, where rocking radiographs are used to measure diffraction intensities. reflections. 
Rice. Fig. 1. X-ray diffraction pattern of the rocking of the seidoserite mineral Na 4 MnTi(Zr,Ti) 2 0 2 (F,OH) 2 2.
X-ray methods. For a complete structural study of a single crystal by X-ray methods. a. it is necessary to determine the position in space and measure the integral intensities of all diffraction. reflections arising from the use of radiation with a given. To do this, during the experiment, the sample must, with an accuracy of the order of arc. minutes to take orientations, for which the conditions (1) are satisfied consistently for all families of crystallographic. sample planes; while many are registered. hundreds and even thousands of diff. reflexes. When registering diffraction x-ray pictures. photographic film, the intensities of reflections are determined by a microdensitometer by the degree of blackening and the size of the diffraction. spots. In decomp. types of goniometers are implemented diff. geom. diffraction registration schemes. paintings. A complete set of diffraction intensities. reflections are obtained on a series of radiographs, reflections are recorded on each radiograph, on crystallographic. indexes to-rykh superimposed def. restrictions. For example, reflections of the type hk0, hk1(rice. 2)
. To establish the atomic structure of a crystal whose unit cell contains ~100 atoms, it is necessary to measure several. thousand diff. reflections. In the case of protein single crystals, the volume of the experiment increases to 10 4 -10 6 reflections. 
Rice. Fig. 2. X-ray diffraction pattern of the mineral seidoserite, obtained in the Weisenberg X-ray goniometer. The registered diffraction reflections have indices. Reflections located on the same curve are characterized by a constant index k.
When replacing film with X-ray counters. quanta increase the sensitivity and accuracy of measuring diffraction intensities. reflections. In modern automatic diffractometers are provided with 4 axes of rotation (3 for the sample and 1 for the detector), which makes it possible to implement diffraction registration methods of various geometries. reflections. Such a device is universal, it is controlled by a computer and specially developed algorithms and programs. The presence of a computer allows you to introduce feedback, optimization of measurements of each diffraction. reflections and, therefore, natures. way to plan the entire diffraction. experiment. Measurements of intensities are made with the statistic required for the structural problem to be solved. accuracy. However, an increase in the intensity measurement accuracy by an order of magnitude requires an increase in the measurement time by two orders of magnitude. The quality of the test sample imposes a limitation on the accuracy of measurements. For protein crystals (see below), the experiment time is reduced by using two-dimensional detectors, in which many measurements are carried out in parallel. tens of diffraction reflections. In this case, the possibility of optimizing measurements at the level of department is lost. reflex.
Method for the study of polycrystals (Debye-Scherrer method). For R. s. a. crystalline powders, ceramic materials, etc. polycrystalline. objects consisting of a large number of small, randomly oriented relative to each other single crystals, monochromatic is used. x-ray radiation. X-ray from polycrystalline. sample (de-bayogram) is a collection of concentric-rich. rings, each of which consists of diffraction. reflections from diff. crystallographic systems oriented in different grains. planes with a certain interplanar distance d. Kit d and their corresponding diffraction intensities. reflections are individual for each crystal. substances. The Debye-Scherrer method is used in the identification of compounds and the analysis of mixtures of polycrystalline. substances by quality. and quantities. the composition of the components of the mixture of phases. An analysis of the distribution of intensities in Debye rings makes it possible to estimate the grain sizes, the presence of stresses, and preferential orientations (texturing) in the arrangement of grains (see Fig. Radiography of materials, Debye - Scherrera method).
In the 1980s - 90s. in R. s. a. began to apply the method of clarifying the atomic structure of the crystal. substances by diffraction. data from polycrystalline. materials proposed by X. M. Rietveld (N. M. Rietveld) for neutron diffraction. research. The Rptveld method (full-profile analysis method) is used when the approximate structural model of the compound under study is known; in terms of the accuracy of the results, it can compete with X-ray diffraction methods for studying single crystals.
Study of amorphous materials and partially ordered objects. The lower the degree of ordering of the atomic structure of the analyte, the more blurred, diffuse nature of the X-ray scattered by it. radiation. However, the diffraction studies of even amorphous objects make it possible to obtain information about their structure. Thus, the diameter of the diffuse ring in the X-ray pattern from an amorphous substance (Fig. 3) allows us to estimate the avg. interatomic distances in it. With an increase in the degree of order in the structure of objects, diffraction. the picture becomes more complex (Fig. 4) and therefore contains more structural information. 
Rice. 3. X-ray pattern of an amorphous substance - cellulose acetate.

Rice. 4. Radiographs of biological objects: a - hair; b - sodium salt of DNA in a wet state; c - DNA sodium salt textures.
Small angle scattering method. In the case when the dimensions of the inhomogeneities in the object of study exceed the interatomic distances and range from 0.5-1 to 10 3 nm, i.e., many times greater than the wavelength of the radiation used, the scattered X-ray. radiation is concentrated near the primary beam - in the region of small scattering angles. The intensity distribution in this region reflects the structural features of the object under study. Depending on the structure of the object and the size of the inhomogeneities, the X-ray intensity. scattering is measured in angles from fractions of a minute to several. degrees.
low angle scattering is used to study porous and fine materials, alloys and biol. objects. For protein molecules and nucleic acids in solutions, the method allows one to determine the shape and size of an individual molecule with a low resolution, they say. mass, in viruses - the nature of the mutual stacking of their constituent components (protein, nucleic acids, lipids), in synthetic. polymers - the packing of polymer chains, in powders and sorbents - the distribution of particles and pores by size, in alloys - to fix the appearance of new phases and determine the size of these inclusions, in textures (in particular, in liquid crystals) - the packing of particles (molecules) in various kinds supramolecular structures. The low-angle method proved to be effective. scattering and for studying the structure of Langmuir films. It is also used in the industry to control the manufacturing processes of catalysts, fine coals, etc.
Analysis of the atomic structure of crystals
Determining the atomic structure of crystals includes: establishing the shape and dimensions of the unit cell, the symmetry of the crystal (its belonging to one of the 230 Fedorov groups) and the coordinates of the basic atoms of the structure. Precision structural studies allow, in addition, to obtain quantities. characteristics of thermal motions of atoms in a crystal and the spatial distribution of valence electrons in it. Methods of Laue and rocking the sample determine the metric of the crystal. gratings. For further analysis, it is necessary to measure the intensities of all possible diffraction. reflections from the test sample for a given l. Primary processing of experiments. data takes into account the geometry of the diffraction. experiment, absorption of radiation in the sample, and other more subtle effects of the interaction of radiation with the sample.
The three-dimensional periodicity of a crystal makes it possible to expand the distribution of its electron in space in a Fourier series:
where V- the volume of the unit cell of the crystal, Fhkl- Fourier coefficients, which are in R. s. a. called structural amplitudes. Each structural amplitude is characterized by integers h, k, l- crystallographic. indices in accordance with (1) and uniquely corresponds to one diffraction. reflection. Expansion (2) is physically realized in diffraction. experiment.
Main the complexity of the structural study lies in the fact that the usual diffraction. experiment makes it possible to measure the intensity of diffraction. bundles I hkl but does not allow fixing their phases. For a mosaic crystal in a kinematic approach ![]() . Analysis of experiments. The array, taking into account the regular extinctions of reflections, makes it possible to unambiguously establish its belonging to one of the 122 roentgens. symmetry groups. In the absence of anomalous scattering, diffraction the picture is always centrosymmetric. To determine the Fedorov symmetry group, it is necessary to find out independently whether the crystal has a center of symmetry. This problem can be solved on the basis of an analysis of the anomalous component of X-ray scattering. rays. In the absence of the latter, statistical curves are constructed. distributions over their values, these distributions are different for centrosymmetric and acentric crystals. The absence of a center of symmetry can be unambiguously established by physical. properties of the crystal (pyroelectric, ferroelectric, etc.).
. Analysis of experiments. The array, taking into account the regular extinctions of reflections, makes it possible to unambiguously establish its belonging to one of the 122 roentgens. symmetry groups. In the absence of anomalous scattering, diffraction the picture is always centrosymmetric. To determine the Fedorov symmetry group, it is necessary to find out independently whether the crystal has a center of symmetry. This problem can be solved on the basis of an analysis of the anomalous component of X-ray scattering. rays. In the absence of the latter, statistical curves are constructed. distributions over their values, these distributions are different for centrosymmetric and acentric crystals. The absence of a center of symmetry can be unambiguously established by physical. properties of the crystal (pyroelectric, ferroelectric, etc.).
The Fourier transform of relation (2) makes it possible to obtain calculated f-ly for calculating the quantities Fhkl(in the general case - complex): 
where - at. X-ray scattering factor radiation by an atom jj, x j , y j , z j- its coordinates; summation goes over all N elementary cell atoms.
The problem, inverse to the structural study, is solved as follows: if the atomic model of the structure is known, then the moduli and phases of the structural amplitudes and, consequently, the diffraction intensity are calculated using (3). reflections. Diffraction experiment makes it possible to measure many hundreds of amplitudes unrelated by symmetry, each of which is determined by (3) by a set of coordinates of the basic (symmetry-independent) atoms of the structure. There are significantly fewer such structural parameters than modules; therefore, there must be connections between the latter. Structural analysis theory made connections different type: inequalities, linear inequalities, structural products and determinants of the relationship of structural amplitudes.
On the basis of naib, effective statistic. ties developed [J. Carle (J. Karle) and X. A. Hauptman (H. A. Hauptman), Nobel Prize, 1985] so-called. direct methods for determining the phases of structural amplitudes. If we take a trio of structural amplitudes with large absolute values, the indices of which are related by simple relations h 1 + h 2 + h 3 = 0, k 1 + k 2 + k 3 = 0, l 1 + l 2 + l 3 = 0, then naib. the probable sum of the phases of these amplitudes will be equal to zero:
The probability of fulfilling equality is higher, the greater the product of the special. in the manner of normalized structural amplitudes included in this relation. As the number of atoms increases N in the elementary cell of the crystal, the reliability of the ratio decreases. In practice, much more complex statistics are used. relations and rather rigorous estimates of the probabilities of fulfillment of these relations. Calculations on these ratios are very cumbersome, the algorithms are complex and are implemented only on powerful modern computers. COMPUTER. Direct methods give the first approximate values of the phases and only the max. strong in normalized modules of structural amplitudes.
For the practice of structural studies, automatic procedures are important. refinement of phases of structural amplitudes. Based on an approximate set of phases of the strongest structural amplitudes and according to the corresponding experiments. modules, according to (2), the first approximate distribution of the electron density in the crystal is calculated. Then it is modified on the basis of physical. and crystallochem. information about the properties of this distribution. For example, at all points in space ![]() , according to the modifications. distribution by Fourier inversion, the refined phases are calculated and, together with the experiment. values are used to construct the next approximation, and so on. After obtaining sufficiently accurate values, according to (2), a three-dimensional distribution of the electron density in the crystal is constructed. It is essentially an image of the structure under study, and all the difficulty in obtaining it is caused by the lack of converging lenses for x-rays. radiation.
, according to the modifications. distribution by Fourier inversion, the refined phases are calculated and, together with the experiment. values are used to construct the next approximation, and so on. After obtaining sufficiently accurate values, according to (2), a three-dimensional distribution of the electron density in the crystal is constructed. It is essentially an image of the structure under study, and all the difficulty in obtaining it is caused by the lack of converging lenses for x-rays. radiation.
The correctness of the obtained atomic model is checked by comparing experiments. and modules of structural amplitudes calculated by (3). Quantity. the characteristic of such a comparison is the divergence factor
This factor makes it possible to obtain the optimum by trial and error. results. For non-crystalline objects it is practically unities. diffraction interpretation method. paintings.
Determining the phases of structural amplitudes by direct methods becomes more complicated with an increase in the number of atoms in the unit cell of the crystal. Pseudosymmetry and certain other features of its structure also limit the possibilities of direct methods.
Another approach to determining the atomic structure of crystals from x-rays. diffraction data was proposed by A. L. Paterson. The atomic model of the structure is based on the analysis of the function of interatomic vectors P(u,v,w)(f-tion of Paterson), which is calculated from the experiment. values . The meaning of this function can be explained using the scheme of its geom. construction. An atomic structure containing in a unit cell N atoms, we place it parallel to itself so that the first atom is at the origin. If we multiply the atomic weights of all atoms of the structure by the value of the atomic weight of the first atom, then we get the weights of the first N peaks f-tsii interatomic vectors. This is the so-called. image of the structure in the first atom. Then, at the origin of coordinates, we place the image of the structure constructed in the same way in the second atom, then in the third, etc. Having done this procedure with all N atoms of the structure, we get N 2 peaks of the Paterson function (Fig. 5). Since atoms are not points, the resulting function P(u,v,w) contains fairly blurred and overlapping peaks: 
Rice. 5. Scheme for constructing the function of interatomic vectors for a structure consisting of three atoms.

[ - volume element in the vicinity of the point ( x,y,z)]. The function of interatomic vectors is constructed from the squares of the modules of experiments. structural amplitudes and is a convolution of the electron density distribution with itself, but after inversion at the origin. 
Rice. 6. Mineral baotite Ba 4 Ti 4 (Ti, Nb) 4 O 16 Cl; a - function of interatomic vectors, projection onto the plane ab, lines of equal level of function values are drawn at equal arbitrary intervals; b - projection of the distribution of electron density on the plane ab, obtained by interpreting the function of interatomic vectors and refining the atomic model, thickening of lines of equal level correspond to the positions of atoms in the structure; c - projection of the atomic model of the structure onto the ab plane in Pauling polyhedra. Si atoms are located inside tetrahedra of oxygen atoms, Ti and Nb atoms are located in octahedrons of oxygen atoms. The tetrahedra and octahedrons in the structure of baotite are connected as shown in the figure. Ba and C1 atoms are shown by black and light circles. Part of the elementary cell of the crystal, shown in figures a and b, corresponds to the figure in the square marked with dashed lines.
Difficulties in interpretation P(u,v,w) are related to the fact that among N 2 peaks of this function, it is necessary to recognize the peaks of one image of the structure. The maxima of the Paterson function overlap significantly, which further complicates its analysis. Naib. easy to analyze the case when the structure under study consists of one heavy atom and several. much lighter atoms. In this case, the image of the structure in a heavy atom stands out in relief against the background of the remaining peaks P(u,v,w). A number of systematic methods have been developed. analysis of functions of interatomic vectors. Naib. effective ones are superpositions. methods when two or more copies P(u,v,w) in parallel position are superimposed on each other with corresponding offsets. At the same time, peaks that naturally coincide on all copies highlight one or more of the N the original image of the structure. As a rule, for unities. images of the structure have to use add. copies P(u,v,w). The problem comes down to finding the necessary mutual offsets of these copies. After localization on the superposition. synthesis of the approximate distribution of atoms in the structure, this synthesis can be subjected to Fourier inversion, and so on. it allows one to obtain the phases of the structural amplitudes. The latter together with the experiment. values are used for construction. All superposition procedures. methods algorithmized and implemented in automatic. mode on the computer. On fig. 6 shows the atomic structure of the crystal, established by superposition methods according to the Paterson function.
Experiments are being developed. methods for determining the phases of structural amplitudes. Phys. The basis of these methods is the Renninger effect - multibeam X-ray. diffraction. If available at the same time x-ray diffraction reflections, there is a transfer of energy between them, which depends on the phase relationships between the data of the diffraction. bundles. The entire pattern of intensity changes is limited by the arc. seconds and for mass structural studies, this technique is practical. has not yet acquired value.
In independent. section R. s. a. allocate precision structural studies of crystals, allowing to obtain diffraction. given not only the model of the atomic structure of the compounds under study, but also the quantities. characteristics of thermal vibrations of atoms, including the anisotropy of these vibrations (Fig. 7) and their deviations from harmonics. law, as well as the spatial distribution of valence electrons in crystals. The latter is important for studying the relationship between atomic structure and physical. properties of crystals. For precision research, special experimental methods. measurements and processing diffraction. data. In this case, accounting is required at the same time. reflections, deviations from the kinematics of diffraction, taking into account dynamic. corrections of the theory of diffraction, and other subtle effects of the interaction of radiation with matter. When specifying the structural parameters, the name method is used. squares, and essential takes into account the correlation between the specified parameters. 
Rice. Fig. 7. Ellipsoids of anisotropic thermal vibrations of atoms of the stable nitrogen strong radical C 13 H 17 N 2 O 2.
R. s. a. used to establish a connection between the atomic structure and the physical. properties, superionic conductors, laser and nonlinear optical. materials, high-temperature superconductors, and others. a. obtained unique results in the study of the mechanisms of phase transitions in solids and biol. activity of macromolecules. Thus, the anisotropy of acoustic absorption. waves in paratellurite single crystals is related to the anharmonicity of thermal vibrations of Te atoms (Fig. 8)
. The elastic properties of lithium tetraborate Li 2 B 4 O 7 , opening up prospects for its use as an acoustic detector. waves, due to the nature of the chemical. links in this connection. With the help of R. s. a. study the distribution in the crystal of valence electrons that realize interatomic bonds in it. These relationships can be explored using the strain distribution. electron density, which is the difference
where is the distribution of electron density in the crystal, is the sum of spherically symmetrical densities of free (not entered into chemical bonds) atoms of a given structure, which are located respectively at points with coordinates x i , y i , z i. When established by X-ray. diffraction deformation data. electron density max. it is difficult to take into account the thermal vibrations of atoms, beings. image correlating with the nature and directions of chemical. connections. So, deformation. density reflects the redistribution in space of that part of the electron density of atoms, which is directly involved in the formation of chemical. connections (Fig. 9). 
Rice. Fig. 8. The nearest environment of tellurium by O atoms in the structure (a) and the anharmonic component of the probability density distribution of the Te atom at a given point in space during thermal vibrations (b). Positive (solid) and negative (dashed) lines of equal level are drawn through 0.02 -3.

Rice. Fig. 9. Cross section of the synthesis of the deformation electron density of a Li 2 B 4 O 7 crystal by a plane passing through the O atoms of the triangular group BO 3, in the center of which is the B atom. The maxima on the segments B - O indicate the covalent nature of the bonds between these atoms. Dashed lines indicate the regions from which the electron density has shifted to chemical bonds. Lines of equal level are drawn through 0.2 .

Rice. 10. Ordered arrangement of Sr atoms over lanthanum positions in the structure Cu atoms
Structural studies of high-temperature superconductors made it possible to establish their atomic structure and its relationship with their physical. properties. It was shown that in single crystals the transition temperature to the superconducting state T s depends not only on the number of Sr, but also on the way it is statistical. accommodation. The uniform distribution of Sr atoms in the structure is optimal for superconducting properties. Sr concentration in def. layers of the structure (Fig. 10) leads to the loss of part of the oxygen in these layers and to a decrease T s. For crystals ![]() R.'s methods of page. a. ordering in the arrangement of O atoms was established. Within the limits of one crystal, the presence of regions of local composition rhombic in symmetry was established
R.'s methods of page. a. ordering in the arrangement of O atoms was established. Within the limits of one crystal, the presence of regions of local composition rhombic in symmetry was established ![]() with T s ~90 K and regions are in [СuО 6 ]-octahedrons. Oxygen deficiency is shown by the absence of one oxygen vertex in one of the Cu polyhedra. Positions completely occupied by La atoms are shown by black circles. The open circles are the positions of lanthanum, in which all Sr atoms are concentrated and statistically located.
with T s ~90 K and regions are in [СuО 6 ]-octahedrons. Oxygen deficiency is shown by the absence of one oxygen vertex in one of the Cu polyhedra. Positions completely occupied by La atoms are shown by black circles. The open circles are the positions of lanthanum, in which all Sr atoms are concentrated and statistically located.
![]() with T c ~ 60 K. In crystals with an amount of oxygen less than 6.5 atoms per unit cell, along with rhombic regions. symmetries of the local composition, regions of tetragonal symmetry of the local composition appear, which do not pass into the superconducting state.
with T c ~ 60 K. In crystals with an amount of oxygen less than 6.5 atoms per unit cell, along with rhombic regions. symmetries of the local composition, regions of tetragonal symmetry of the local composition appear, which do not pass into the superconducting state.

Rice. 11. Atomic model of the molecule of guanyl-specific ribonuclease C 2, built on the basis of X-ray diffraction study of single crystals of this protein with a resolution of 1.55
To solve many problems of solid state physics, chemistry, molecular biology, etc. The combined use of X-ray diffraction analysis and resonance methods (EPR, NMR, etc.) is very effective. At a research of an atomic structure of proteins, nucleinic to - t, viruses, etc. objects of molecular biology there are specific. difficulties. macromolecules or. larger biol. objects must first be obtained in monocrystalline. form, after which it is possible to apply all methods of R. to their research. a., developed for the study of crystalline. substances. The problem of phases of structural amplitudes for protein crystals is solved by the method of isomorphic substitutions. Along with single crystals of the studied native protein, single crystals of its derivatives with heavy atomic additives isomorphic to the crystals of the studied protein are obtained. Difference Paterson functions for derivatives and native protein make it possible to localize the positions of heavy atoms in the unit cell of the crystal. The coordinates of these atoms and the sets of modules of the structural amplitudes of the protein and its heavy atomic derivatives are used in special. algorithms for estimating the phases of structural amplitudes. In protein crystallography, step-by-step methods for establishing the atomic structure of macromolecules are used with succession. transition from low to higher resolution (Fig. 11). Developed and special methods for refining the atomic structure of macromolecules by X-ray. diffraction data. The volumes of calculations are so large that they can be effectively implemented only on the most powerful computers.
R.'s questions with. a., associated with the study of the real structure of a solid body by diffraction. data discussed in Art. Radiography of materials.
Lit.: Belov N.V., Structural crystallography, Moscow, 1951; B about to and y G. B., Poray-Koshits M. A., X-ray structural analysis, 2nd ed., Vol. 1, M., 1964; Lipson G., Kokren V., Determination of the structure of crystals, trans. from English, M., 1956; Burger M., Structure of crystals and vector space, transl. from English, M., 1961; Gin'e A., Radiography of crystals. Theory and practice, trans. from French, Moscow, 1961; Stout G, H., J e n s e n L. H., X-ray structure determination, N. Y.-L., 1968; X e and er D. M., X-ray diffractometry of single crystals, L., 1973; Blundel T., Johnson L., Protein crystallography, trans. from English, M., 1979; Vainshtein BK, Symmetry of crystals. Methods of structural crystallography, M., 1979; Electron and magnetization densities in molecules and crystals, ed. by P. Becker, N. Y.-L., 1980; Crystallography and crystal chemistry, M., 1986; Structure and physical properties of crystals, Barcelona, 1991. V. I. Simonov.
For modern people, free divination online is a wonderful opportunity ...

Fortune telling on paper is distinguished by its simplicity and minimal requirements for ...
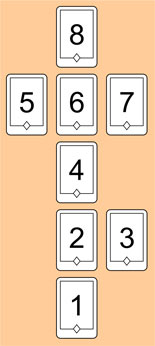
It happens that a person loses support in his life and ceases to understand it ...